Chapter 7 Immune Infiltration
Cell infiltration estimation in the tumor microenvironment
The tumor microenviroment (TME) is a complicated system consisting of immune cells, stromal cells, and extracellular factors. Estimating cell components is essential for classifying the distinct tumor immune microenvironment (TIME) phenotype. Furthermore, dissecting the TIME by evaluating cell components plays a significant role in untangling the mechanisms of tumor progression and immune evasion, which is essential for providing a guideline for immunotherapy selection.
There are two major approaches for estimating cell infiltration in the TME – 1) deconvolution-based and 2) marker-based approaches. Deconvolution-based methods use weighted mathematical models that infer cell type fractions from the bulk gene expression of a given list of signature genes. Algorithms such as TIMER, quanTIseq, EPIC, and CIBERSORT use deconvolution-based methods. Algorithms such as xCell and MCP-counter use marker-based approaches to quantify the enrichment score utilizing a list of cell-specific marker genes. ImmuneDeconv is an R package that integrates these six algorithms. All six algorithms estimate cell infiltration of immune cells and stromal cells, while EPIC and quanTIseq also assess uncharacterized cells defined as cancer cells. Of note, CIBERSORT absolute mode, EPIC, and quanTIseq support inter-comparison between sample groups and intra-comparison between cell types. And TIMER, xCell, and MCP-counter support only inter-comparison between sample groups for one cell type. Immune cell deconvolution is still an open question in the field, and different algorithms could give slightly different results. Each algorithm estimates one general cell type or specific cell subtype. When a gold standard is not available, is is best to focus on the observations consistently predicted by the various algorithms.
Note: RIMA uses Cibersort in the immune_infiltration moduls. Use of Cibersort requires registration for use of their gene signature matrix. In order to run the immune_infiltration module of RIMA, you must register and download the LM22.txt matrix from the CIBERSORT website . Once you obtain this file, add it to the ~/RIMA/RIMA_pipeline/static/cibersort folder.
7.0.1 Cibersort
CIBERSORT is a deconvolution-based method that uses the v-support vector regression method (v-SVR) to estimate each immune cell type’s relative proportion from a gene expression profile (GEP). It requires an input of reference gene expression signatures. CIBERSORT provides a gene signature matrix (LM22.txt) which contains 547 genes and distinguishes 7 T-cell types, naïve and memory B cells, plasma cells, and NK cells. The CIBERSORT absolute mode scales cellular fractions to a score that reflects each cell type’s absolute proportion, allowing comparison across both samples and cell types.
The CIBERSORT source code and LM22 signature matrix are only freely available to academic users – register for access on the CIBERSORT website .
To run CIBERSORT using ImmuneDeconv:
#demo
suppressMessages(library(immunedeconv))
#read gene expression matrix
input <- "tpm_convertID.txt"

#load CIBERSORT source code and signature matrix
source("CIBERSORT.R")
sig_matrix <- "LM22.txt"

#Run CIBERSORT abs
#The number of permutation
cibersort_perm = 100
#Quantile normalization of input mixture, default = FALSE for RNA-Seq data
cibersort_qn = FALSE
#whether to apply absolute mode in cibersort
cibersort_abs = TRUE
#sig.score = for each mixture sample, define S as the median expression,level of all genes in the signature matrix divided by the median expression level of all genes in the mixture. Multiple cell subset fractions by S.
cibersort_abs_method = "sig.score"
res_ciber <- CIBERSORT(sig_matrix, input, perm = cibersort_perm, QN = cibersort_qn, absolute = cibersort_abs,
                       abs_method = cibersort_abs_method)

head(res_ciber,3)
## B cells naive B cells memory Plasma cells T cells CD8
## SRR8281218 0.002023271 0.003060637 0.000000000 0.12297118
## SRR8281219 0.010693087 0.000000000 0.001201108 0.38499197
## SRR8281226 0.000000000 0.008281786 0.000000000 0.01442307
## T cells CD4 naive T cells CD4 memory resting
## SRR8281218 0 0.14975225
## SRR8281219 0 0.22216858
## SRR8281226 0 0.08219228
## T cells CD4 memory activated T cells follicular helper
## SRR8281218 0 0.08924869
## SRR8281219 0 0.16924345
## SRR8281226 0 0.06671124
## T cells regulatory (Tregs) T cells gamma delta NK cells resting
## SRR8281218 0.09617560 0 0.06763887
## SRR8281219 0.00000000 0 0.00000000
## SRR8281226 0.04296535 0 0.07211706
## NK cells activated Monocytes Macrophages M0 Macrophages M1
## SRR8281218 0.0000000 0.06195550 0.0000000 0.01550602
## SRR8281219 0.1076938 0.03659288 0.1552708 0.03207925
## SRR8281226 0.0357515 0.41486727 0.0000000 0.00000000
## Macrophages M2 Dendritic cells resting Dendritic cells activated
## SRR8281218 0.7049077 0 0.000000000
## SRR8281219 1.1589577 0 0.000000000
## SRR8281226 0.6474766 0 0.004669831
## Mast cells resting Mast cells activated Eosinophils Neutrophils
## SRR8281218 0.11994310 0 0.003766691 0.00000000
## SRR8281219 0.24218289 0 0.000000000 0.07942792
## SRR8281226 0.01289667 0 0.002926060 0.12361329
## P-value Correlation RMSE Absolute score (sig.score)
## SRR8281218 0.02 0.15699314 1.027475 1.436950
## SRR8281219 0.21 0.05195861 1.072383 2.600503
## SRR8281226 0.03 0.13503937 1.054532 1.5288927.0.2 TIMER
TIMER (Tumor IMmune Estimation Resource) uses linear least square regression to estimate six tumor-infiltrating immune cell types (B, CD4T, CD8T, neutrophils, macrophages, and dendritic cells). Since the tumor purity is very different across different cancer cell types, TIMER selects specific genes as immune signatures based on the correlation between gene expression and tumor purity. (see Bo Li, et al. for more information.
Tutorial of TIMER:
Tutorial of TIMER2:
Note that the TIMER score can only be compared within samples, and the current version of TIMER supports 23 different TCGA cancer types.
#load gene expression matrix
df <- read.table(input, sep = ",", row.names = 1, header = TRUE, check.names = FALSE)

#The TCGA cancer acronyms of demo data
cancertype <- "GBM"
#Available cancer type
immunedeconv::timer_available_cancers
res_timer = as.data.frame(deconvolute(df, "timer",indications=rep(tolower(cancertype),ncol(df))))
7.0.3 quanTIseq
quanTIseq uses constrained least square regression to estimate absolute proportions of the infiltration levels of 10 immune cell types from RNA seq data. Therefore, the score of quanTIseq allows inter- or intra-sample comparison. quanTIseq provides an entire pipeline that can either process the pre-computed gene expression matrix (TPM matrix) or directly analyze bulk RNA-Seq data. RIMA uses the TPM matrix generated in the proprocessing modules for all immune infiltration algorithms.
7.0.4 xCell
xCell performs single-sample gene set enrichment analysis (ssGSEA) on expression data to evaluate the enrichment of immune marker genes. These marker genes were validated using cytometry immunophenotyping and in-silico simulations. Note that results of xCell depend on the number of samples. The power of estimation might be lower if your dataset has limited non-heterogeneous samples.
7.0.5 EPIC
EPIC uses constrained least square regression to estimate six immune cell types, fibroblasts, and endothelial cells. EPIC collects a unique gene expression reference from circulating and tumor-infiltrating cells. Further, it extended its algorithm to evaluate the uncharacterized cancer cells. The score that comes from the EPIC algorithm is an absolute value that can be compared within or across samples.
7.0.6 MCP-counter
MCP-counter uses its transcriptomic markers (TM) curated from 81 public datasets to estimate fibroblasts, endothelial cells, and eight immune cell types.
7.1 Running the immune_infiltration_cohort module
To run the immune_infiltration module of RIMA, make sure you have downloaded the LM22.txt file for Cibersort. (Please see the introduction of this chapter for more information.)
In the execution.yaml file, set immune_infiltration_cohort to true. (There is no immune_infiltration_individual module.) To facilitate phenotype comparisons, set up the Group column of the metasheet.csv and the “design”, “Treatment”, “Control” and “batch” parameters of config.yaml as described in Chapters 2.3 and 4.2, respectively.
7.2 immune_infiltration_cohort Output
The immune_infiltration_cohort module of RIMA will create output files in the analysis/immune_infiltration folder of RIMA_pipeline. Two types of files will be created:
- txt files with the output from each immune deconvolution algorithm (e.g. quantiseq.txt, xcell.txt, etc.)
- png image files for 8 cell types. (B cells, CD4 T cells, CD8 Tcells, DCs, Macrophages, Treg cells, NK cells and Neutrophils) These image files display Spearman correlation values for all six algorithms, allowing you to compare cell estimations between algorithms.
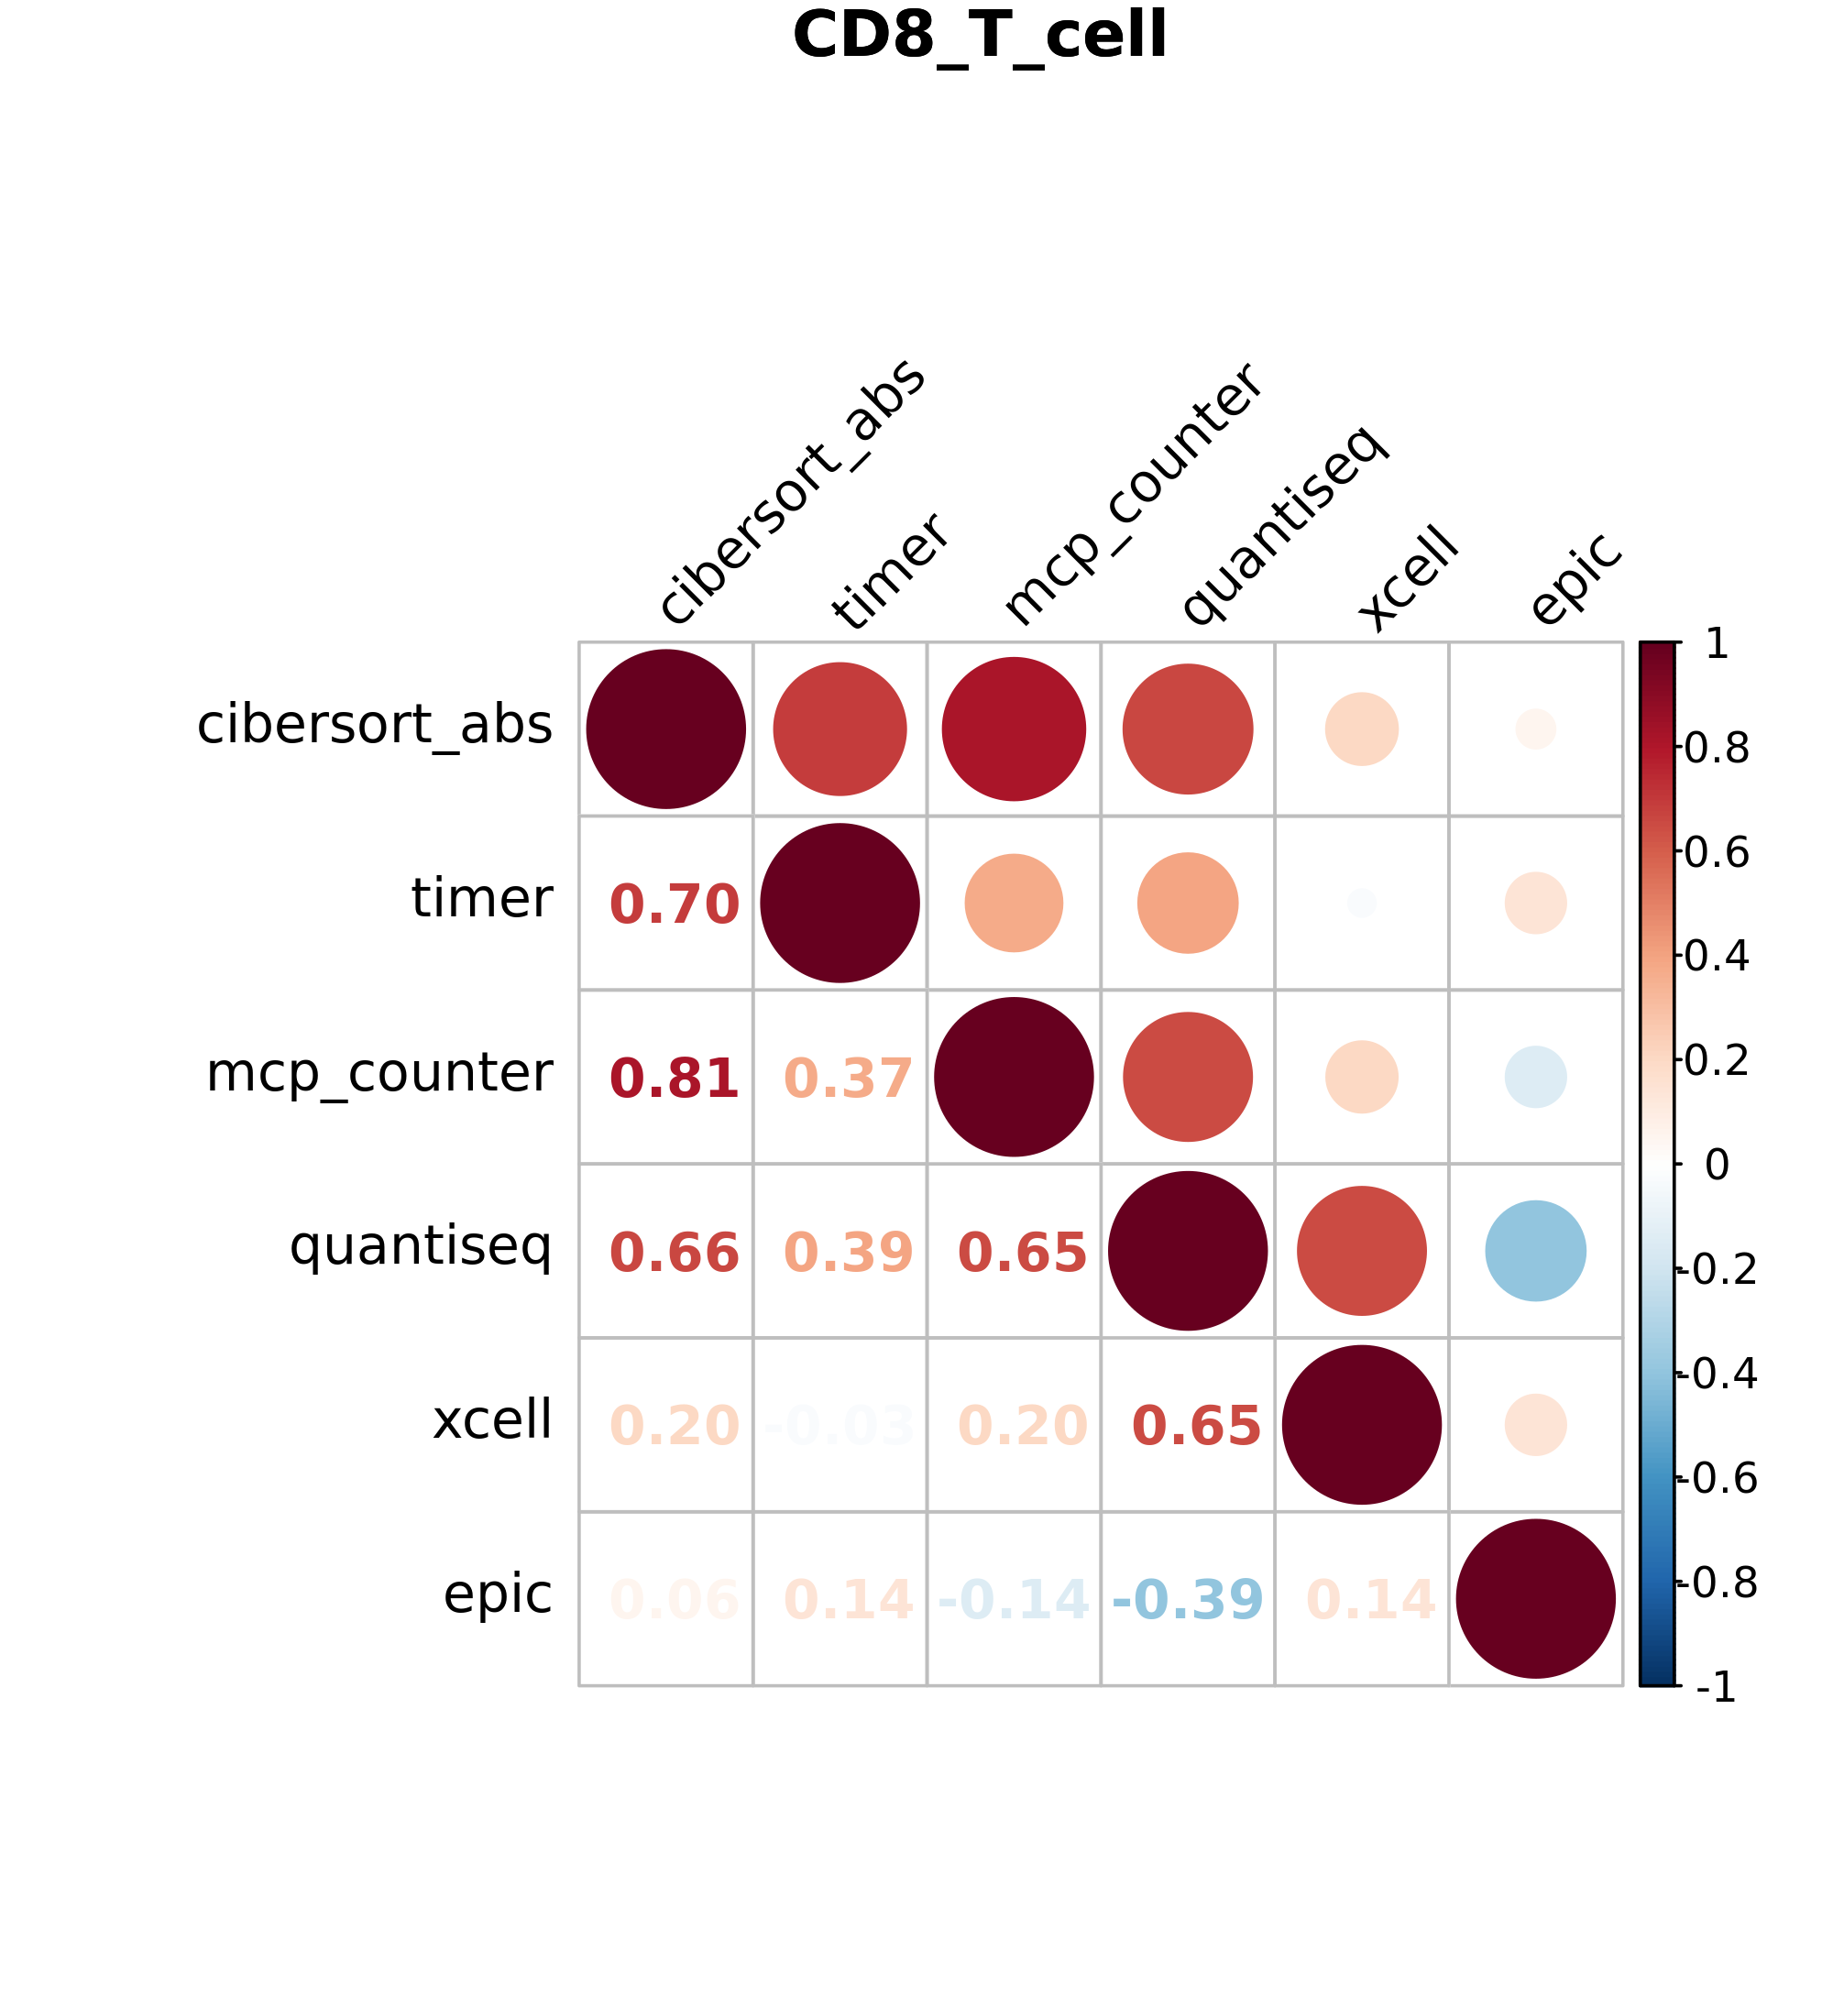
Figure 7.1: Volcano plot
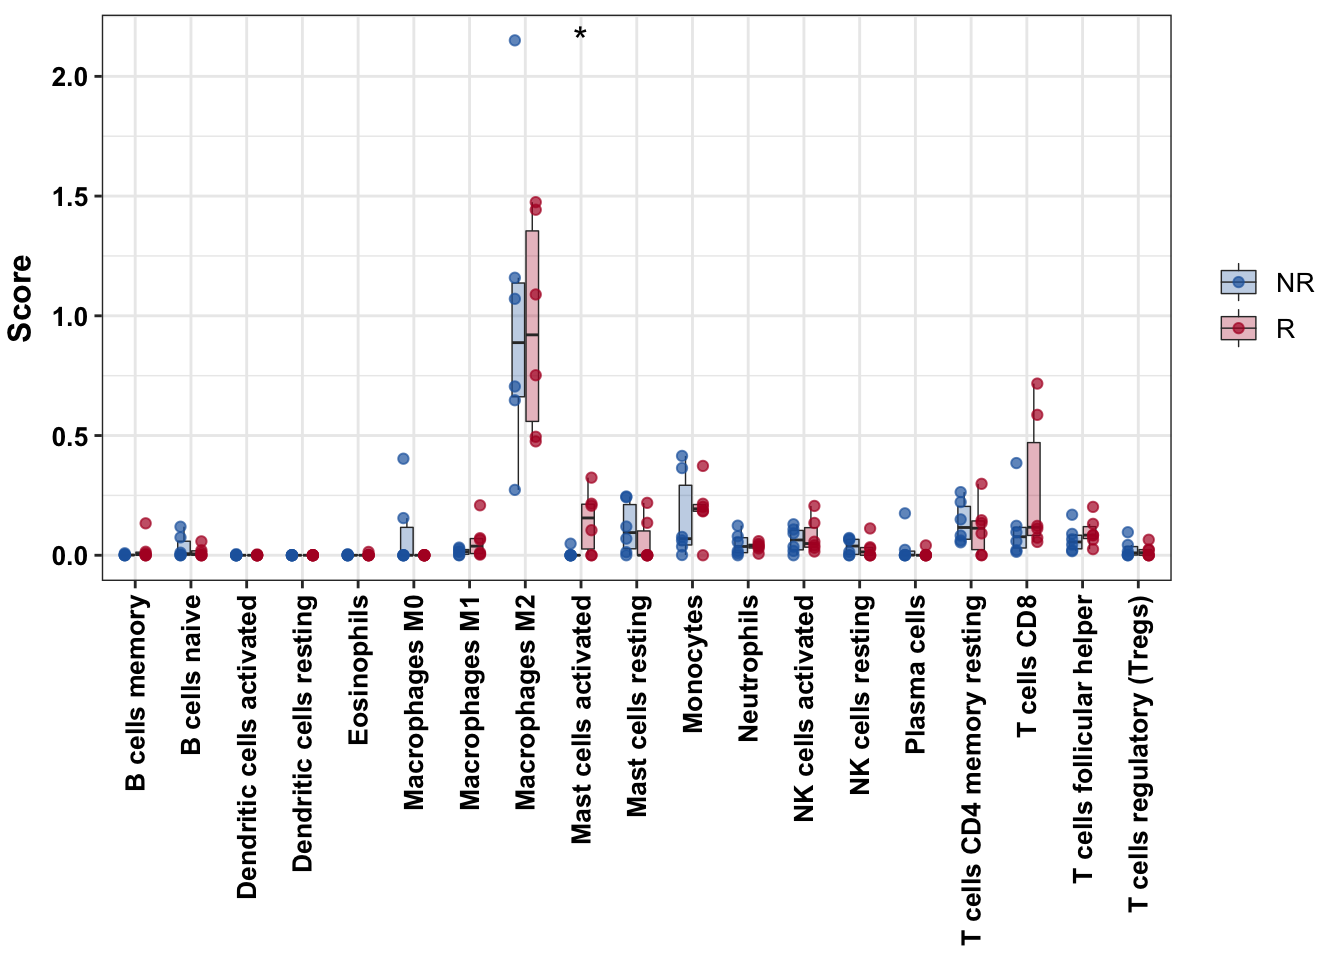
7.3 Additonal comparisons across cell type and across samples
Once the immune_infiltration_cohort module of RIMA is completed, you can use the output files to execute additional comparisons. In the sections below, we provide additional code that you can copy and use to generate a heatmap for comparisons across cell types or a boxplot for comparisons across samples.
In the code below, CIBERSORT abs results are used as an example. In the hmap and boxfig calls, set “phenotype” to the appropriate column in metasheet.csv.
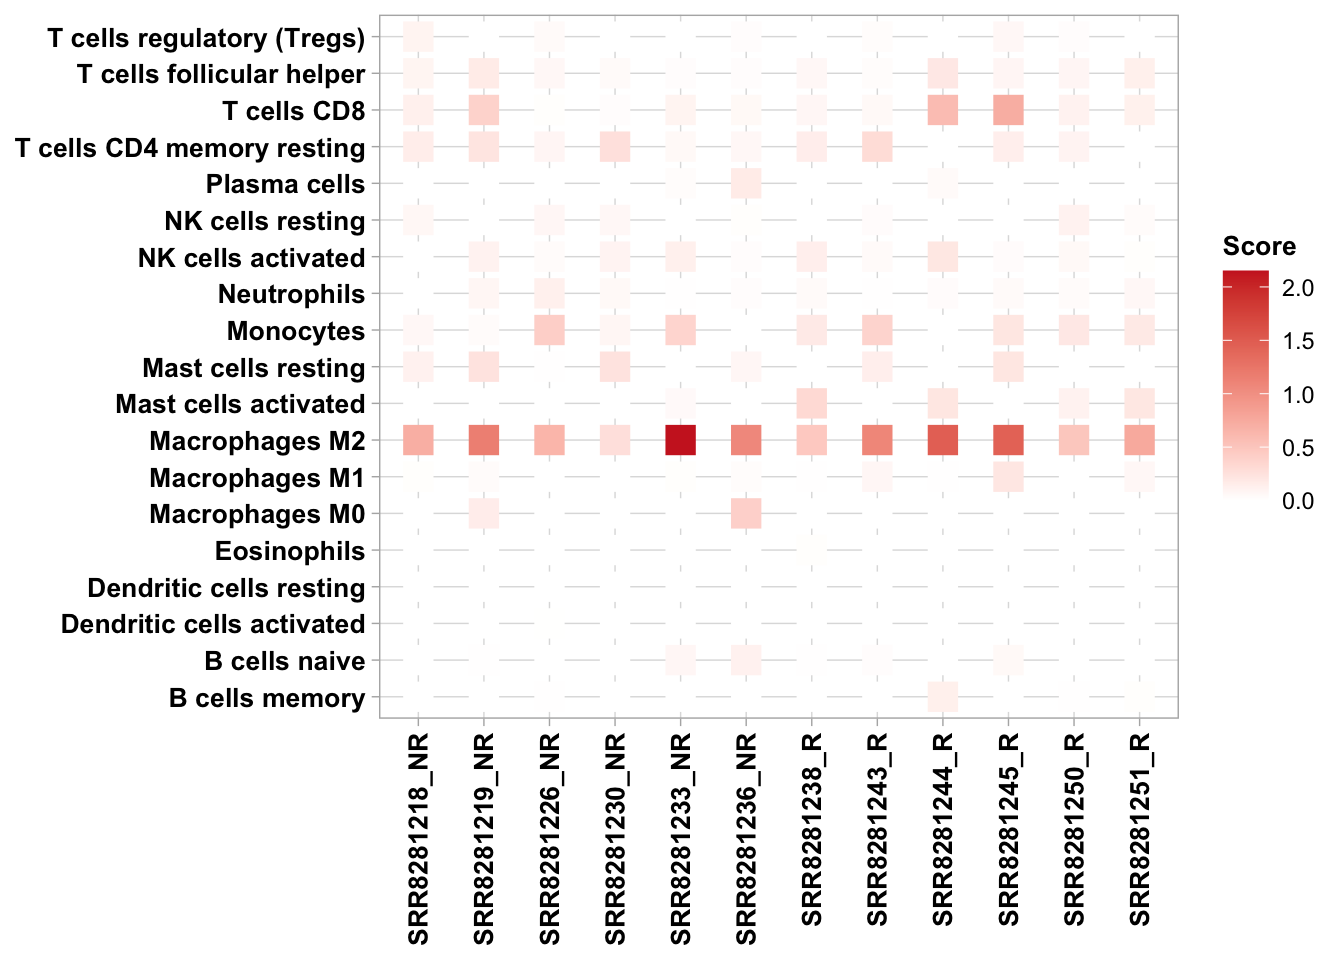
7.3.1 Comparison across cell type
##            B cells naive B cells memory Plasma cells T cells CD8
## SRR8281218   0.002023271    0.003060637  0.000000000  0.12297118
## SRR8281219   0.010693087    0.000000000  0.001201108  0.38499197
## SRR8281226   0.000000000    0.008281786  0.000000000  0.01442307
## SRR8281236   0.119197082    0.000000000  0.175028807  0.05841897
## SRR8281230   0.000000000    0.001725996  0.000000000  0.02099308
## SRR8281233   0.074569126    0.000000000  0.022548328  0.09612605
## SRR8281244   0.000000000    0.133329588  0.041170411  0.58644201
## SRR8281245   0.057960600    0.000000000  0.001729094  0.71691961
## SRR8281243   0.021015715    0.000000000  0.000000000  0.05560813
## SRR8281251   0.000000000    0.014652173  0.000000000  0.12265135
## SRR8281238   0.010961877    0.000000000  0.000000000  0.07328546
## SRR8281250   0.000000000    0.007211828  0.000000000  0.11124637
##            T cells CD4 naive T cells CD4 memory resting
## SRR8281218                 0               0.1497522454
## SRR8281219                 0               0.2221685808
## SRR8281226                 0               0.0821922827
## SRR8281236                 0               0.0616983261
## SRR8281230                 0               0.2636255094
## SRR8281233                 0               0.0540161771
## SRR8281244                 0               0.0000000000
## SRR8281245                 0               0.1346463483
## SRR8281243                 0               0.2983063326
## SRR8281251                 0               0.0008469304
## SRR8281238                 0               0.1462044340
## SRR8281250                 0               0.0912421429
##            T cells CD4 memory activated T cells follicular helper
## SRR8281218                            0                0.08924869
## SRR8281219                            0                0.16924345
## SRR8281226                            0                0.06671124
## SRR8281236                            0                0.02097714
## SRR8281230                            0                0.04434860
## SRR8281233                            0                0.01702242
## SRR8281244                            0                0.20198021
## SRR8281245                            0                0.08491094
## SRR8281243                            0                0.02547211
## SRR8281251                            0                0.13107578
## SRR8281238                            0                0.06549731
## SRR8281250                            0                0.08310786
##            T cells regulatory (Tregs) T cells gamma delta NK cells resting
## SRR8281218                0.096175601                   0       0.06763887
## SRR8281219                0.000000000                   0       0.00000000
## SRR8281226                0.042965351                   0       0.07211706
## SRR8281236                0.016105425                   0       0.01389437
## SRR8281230                0.003663422                   0       0.06303278
## SRR8281233                0.000000000                   0       0.00000000
## SRR8281244                0.000000000                   0       0.00000000
## SRR8281245                0.064756411                   0       0.00000000
## SRR8281243                0.024209477                   0       0.02796011
## SRR8281251                0.000000000                   0       0.03345416
## SRR8281238                0.000000000                   0       0.00000000
## SRR8281250                0.021319048                   0       0.11199972
##            NK cells activated    Monocytes Macrophages M0 Macrophages M1
## SRR8281218         0.00000000 0.0619555028      0.0000000   0.0155060204
## SRR8281219         0.10769382 0.0365928767      0.1552708   0.0320792458
## SRR8281226         0.03575150 0.4148672695      0.0000000   0.0000000000
## SRR8281236         0.01814658 0.0009746492      0.4032181   0.0265143088
## SRR8281230         0.09185887 0.0765481976      0.0000000   0.0007397341
## SRR8281233         0.12935356 0.3642042042      0.0000000   0.0146104309
## SRR8281244         0.20599738 0.0000000000      0.0000000   0.0111442172
## SRR8281245         0.03120120 0.2150193255      0.0000000   0.2086448744
## SRR8281243         0.04129983 0.3731328017      0.0000000   0.0712853735
## SRR8281251         0.01556184 0.1857497242      0.0000000   0.0649557029
## SRR8281238         0.13490224 0.1832561460      0.0000000   0.0058262672
## SRR8281250         0.05657334 0.2021661178      0.0000000   0.0026188791
##            Macrophages M2 Dendritic cells resting Dendritic cells activated
## SRR8281218      0.7049077            0.0000000000               0.000000000
## SRR8281219      1.1589577            0.0000000000               0.000000000
## SRR8281226      0.6474766            0.0000000000               0.004669831
## SRR8281236      1.0709844            0.0000000000               0.000000000
## SRR8281230      0.2730022            0.0005978992               0.000000000
## SRR8281233      2.1503686            0.0000000000               0.000000000
## SRR8281244      1.4746127            0.0000000000               0.000000000
## SRR8281245      1.4430364            0.0000000000               0.000000000
## SRR8281243      1.0892152            0.0000000000               0.000000000
## SRR8281251      0.7517625            0.0000000000               0.000000000
## SRR8281238      0.4755445            0.0004518878               0.000000000
## SRR8281250      0.4947339            0.0000000000               0.003493596
##            Mast cells resting Mast cells activated Eosinophils Neutrophils
## SRR8281218         0.11994310           0.00000000 0.003766691 0.000000000
## SRR8281219         0.24218289           0.00000000 0.000000000 0.079427915
## SRR8281226         0.01289667           0.00000000 0.002926060 0.123613285
## SRR8281236         0.06937423           0.00000000 0.000000000 0.017959545
## SRR8281230         0.24554128           0.00000000 0.000000000 0.055268474
## SRR8281233         0.00000000           0.04839376 0.000000000 0.008407325
## SRR8281244         0.00000000           0.21527869 0.000000000 0.028385274
## SRR8281245         0.21885148           0.00000000 0.000000000 0.040372665
## SRR8281243         0.13542538           0.00000000 0.000000000 0.006578541
## SRR8281251         0.00000000           0.20693722 0.001084478 0.058856146
## SRR8281238         0.00000000           0.32409274 0.013953275 0.047135836
## SRR8281250         0.00000000           0.10459983 0.000000000 0.035923878
#load plotfunction
source("plotfunction.R")
#load metasheet for RIMA pipeline
metasheet <- read.csv("metasheet.csv")
#methods: CIBERSORT, quanTIseq, EPIC, MCP, xCell, TIMER
hmap(ta = res_ciber, meta = metasheet, methods = "CIBERSORT", phenotype = "Responder")