Chapter 10 Fusion
Fusion genes have been considered a type of cancer driver which exert their oncogenic impact on tumor progression through chromosome rearrangement. There are two major fusion detection strategies: 1) read mapping-first which identifies discordant mapping reads as rearrangements; or 2) transcript assembly-first which identifies chimeric transcripts consistent with known rearrangements. Large-scale tumor sample screening requires fast and accurate fusion detection tools. STAR-Fusion is a common tool to predict fusions from the transcriptome which leverages discordant and chimeric read alignments from STAR.
The output from STAR-fusion may include homologous fusion genes. After identifying fusion genes using STAR-fusion, RIMA will filter out homologous fusion genes using pyPRADA. pyPRADA calculates a homology score according to the sequence similarity of the two fusion transcripts. Fusion genes with a BitScore < 100 are filtered from the final output of STAR-fusion.
10.1 Fusion calling
In the mutation module of RIMA, RIMA runs STAR Fusion to generate a list of candidate fusion transcripts from the the chimeric output file ‘{sample_id}.Chimeric.out.junction’ generated by STAR as mentioned in Chapter 3.1. The output from STAR-Fusion is a tab-delimited file named ‘star-fusion.fusion_predictions.tsv’. This file provides information on fused gene names, junction read count and breakpoint information which are used in the next section.
STAR-Fusion --chimeric_junction analysis/star/sample/sampleChimeric.out.junction
            --genome_lib_dir ./ref_files/fusion_gdc_index/GRCh38_v22_CTAT_lib_GDC_Mar162019/ctat_genome_lib_build_dir
            --output_dir analysis/fusion/sample
10.2 Remove fusion homology
RIMA uses pyPRADA to calculate the homology score between the two genes in the fusion calling result. RIMA first removes the duplicated fusion genes from the fusion calling result and then runs homology between the genes. This part requires a configuration file containing information about the gene annotation and the output feature file. These are pre-compiled and can be found in RIMA’s static directory.
prada-homology  -i analysis/fusion/sample_pyprada_fusion_table.txt
                -o analysis/fusion/sample_pyprada_output.txt
                -tmpdir analysis/fusion/tmp/
                -conf static/fusion/prada_config.txt
The output of the homology is generally a text file which contains information on Identity, Alignment length, Evalue and BitScore for each pair of fusion genes. Fusion gene pairs with BitScore < 100 will be filtered out. Below is an example of the homology scores from pyPRADA:
10.3 Comparison within phenotype
RIMA has a customized script that annotates genes as cancer drivers, oncogenes or tumor suppressors. RIMA also plots gene fusion expression between treatment (responders) and control (non-responders).
Rscript src/mutation/fusion_plot.R --pradafusion analysis/fusion/Group_pyprada_output.txt --meta metasheet.csv --expression analysis/batchremoval/tpm.genesymbol.batchremoved.csv --annot static/fusion/cancerGeneList.tsv --outdir analysis/fusion/ --phenotype Group --input analysis/fusion/merged_Group_predictions.abridged_addSample.tsv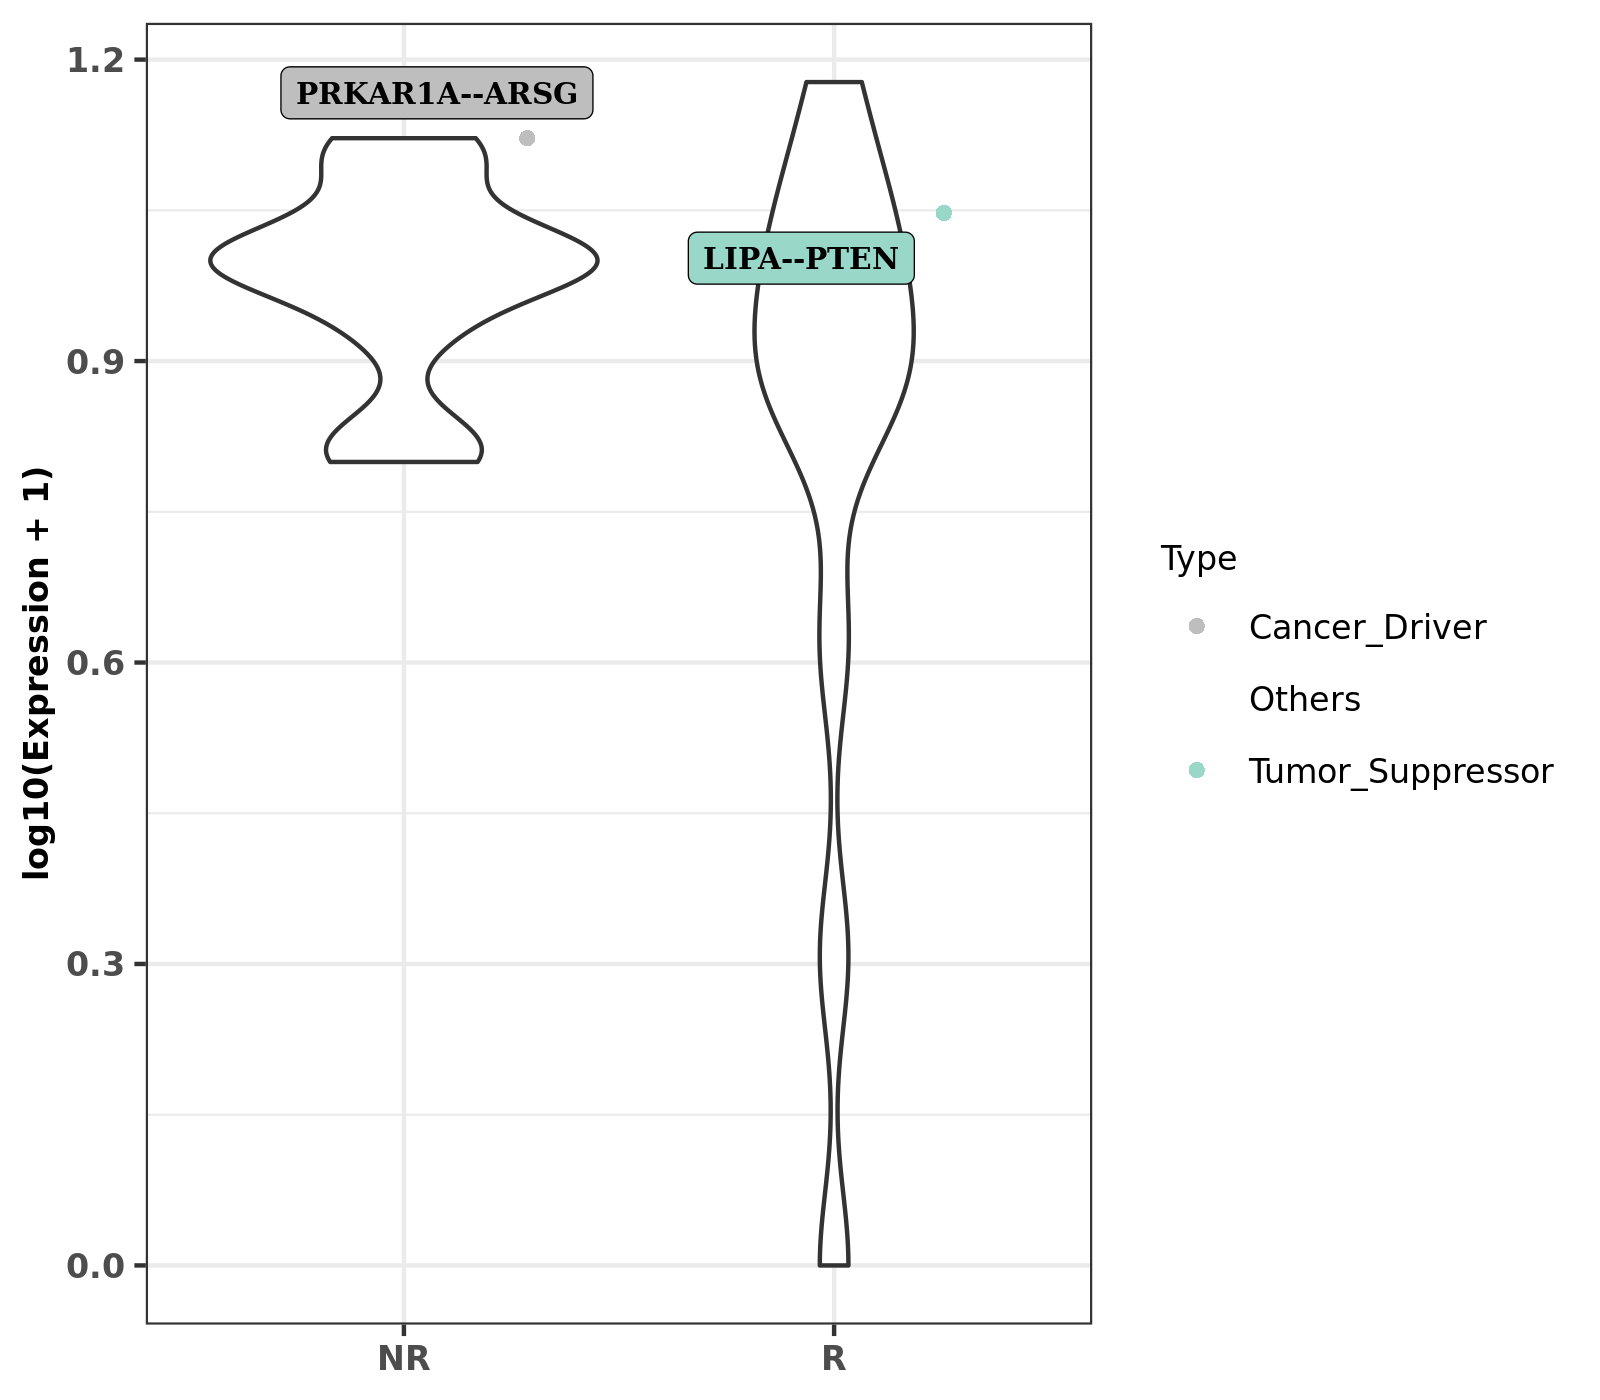
Figure 10.1: Fuison violine plot
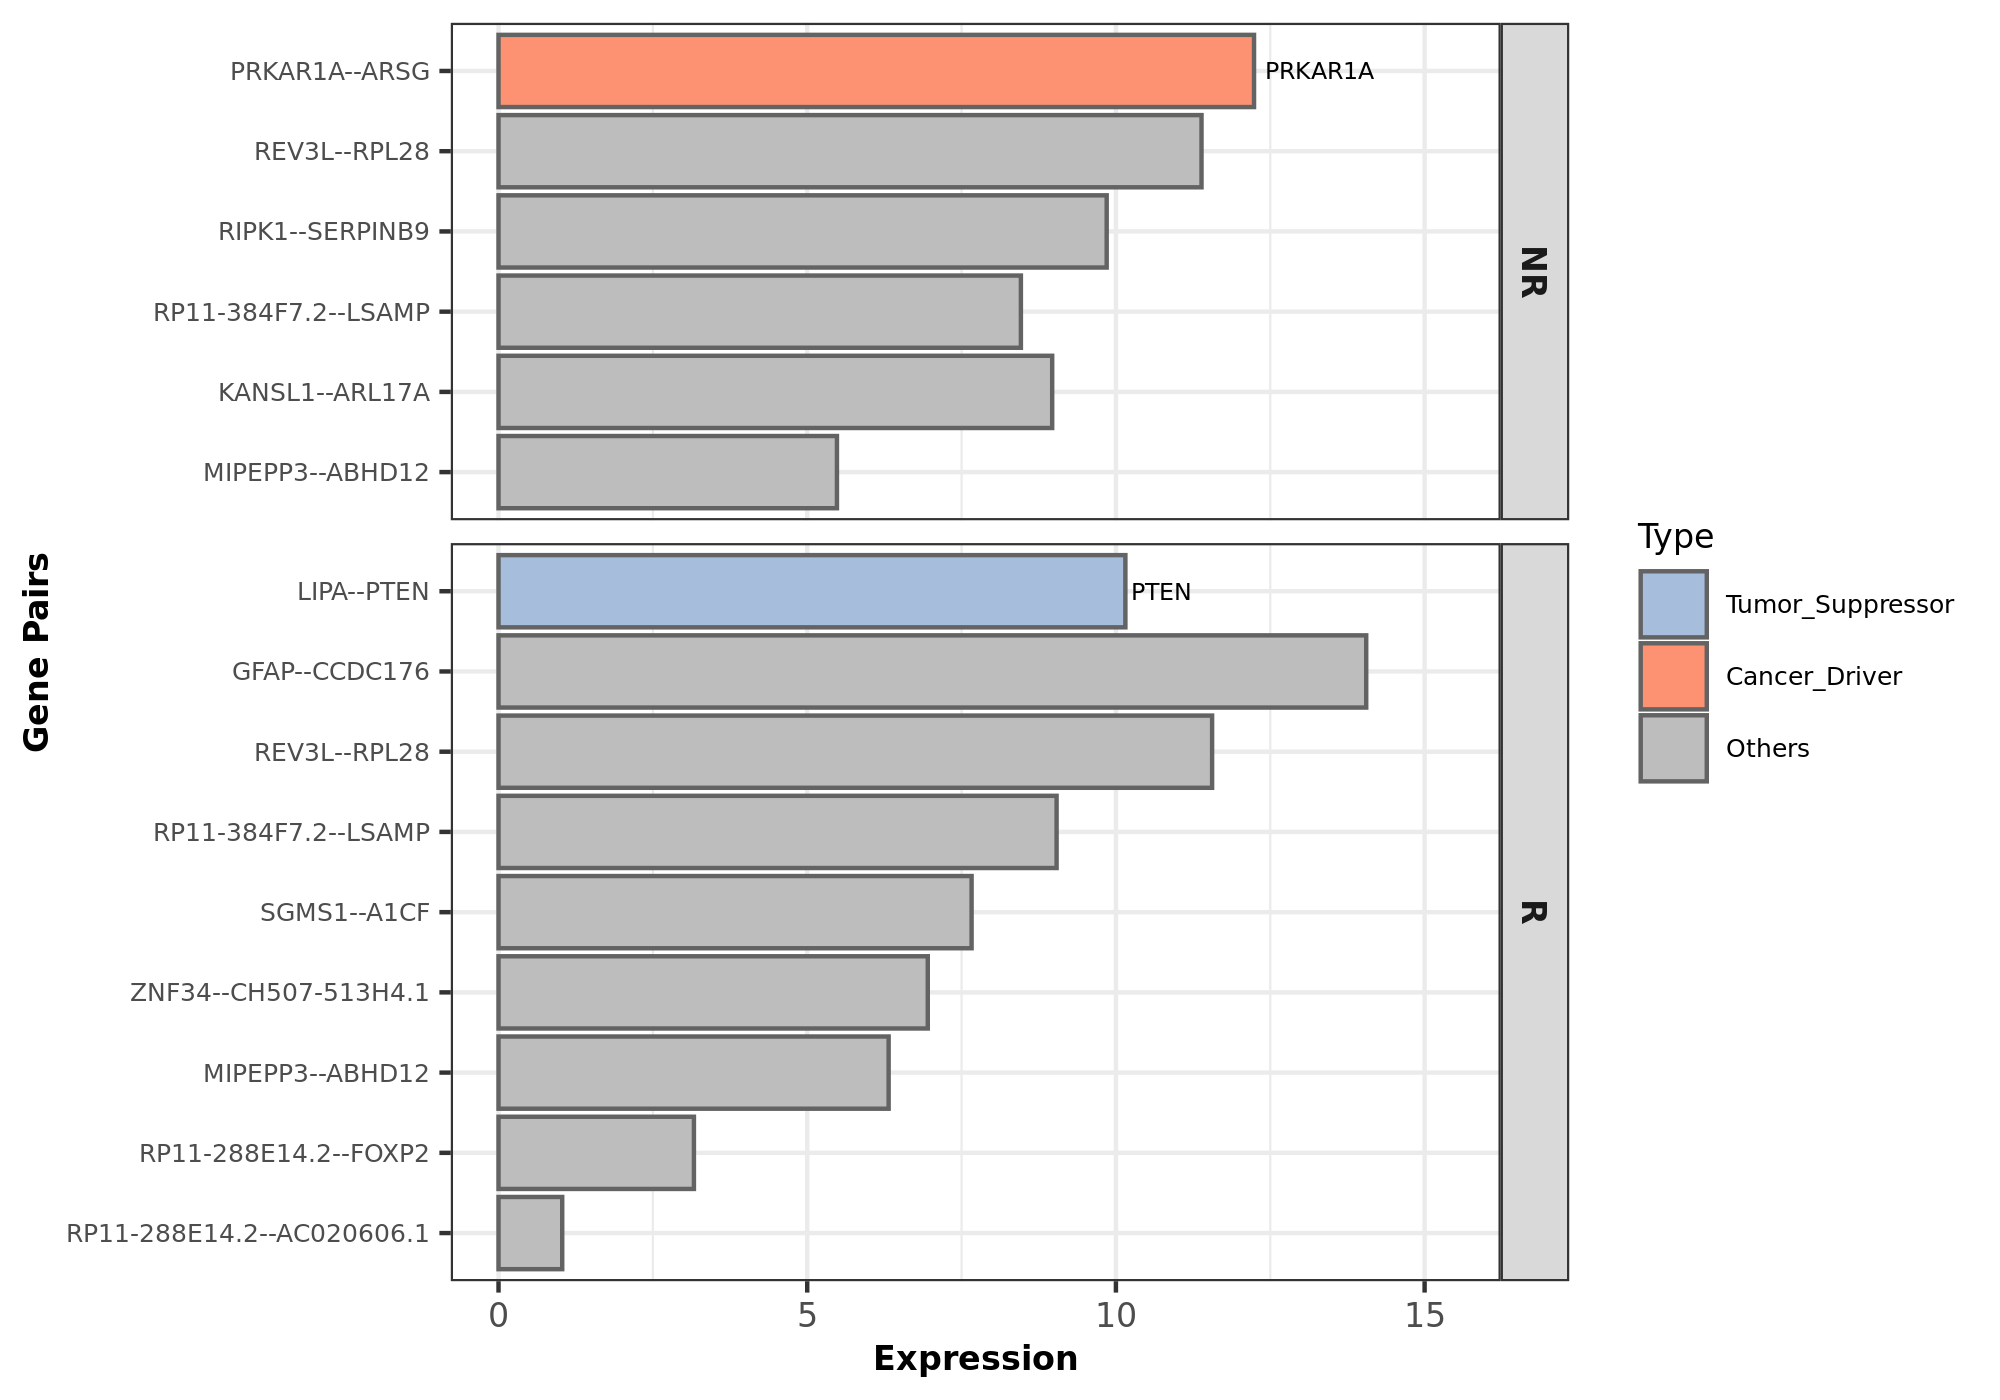
Figure 10.2: Fusion box plot