Chapter 8 Immune Response
RIMA’s immune_response module will run two tools – TIDE and MSISensor2. Background and specific details about both of these tools is included below.
8.1 Characterizing the TME and T cell functionality
Cancer immunotherapy utilizing immune checkpoint blockade (ICB) has made excellent progress in treating advanced-stage patients. However, only a small fraction of patients achieve a response to immunotherapy due to the complexity and heterogeneity of the TME. An increasing number of biomarkers have widely been used to estimate the clinical effectiveness of immunotherapy, such as ICB-related gene signatures (PD1, PDL1, CTLA4), tumor-infiltrating lymphocytes, tumor mutation burden, neoantigens, microsatellite instability (MSI) and serum markers. Nevertheless, there is an urgent need to build a method integrating multiple dynamic factors to characterize the TME and predict immunotherapy response. Currently, two major approaches have been effectively utilized in immunotherapy response prediction. In one approach models are constructed using transcriptome expression profiles of immune checkpoint or T-cell activity. In the other approach, artificial intelligence-based algorithms are developed using imaging characteristics of lesions. For tumor RNA-seq data, TIDE (Tumor Immune Dysfunction and Exclusion) models tumor immune evasion by combining gene signatures estimating T cell dysfunction and exclusion to predict ICB response, which may provide critical insights to guide clinical treatment. This computational framework computes the TIDE score for tumors and separates them into responders and non-responders. In detail, TIDE provides a T cell dysfunction score, a T cell exclusion score, a cytotoxic T lymphocyte score, and scores of cell types restricting T cell infiltration in TME, including cancer-associated fibroblasts (CAF), myeloid-derived suppressor cells (MDSC), and M2 macrophages. These metrics help the biologists understand the TME status or T cell functions of interest. In this case, tumor RNA-seq profiling leverages the power of gene signature expression for quantifying the dynamic TME status, providing guidance for immunotherapy response prediction for clinicians.
8.2 TIDE
TIDE is both a transcriptome biomarker database of ICB response and a set of algorithms to model tumor immune dysfunction and exclusion and predict immunotherapy response. The statistical model of TIDE was trained on clinical tumor profiles without ICB treatments since the immune evasion mechanisms in treatment naïve tumors are also likely to influence patient response to immunotherapies. The TIDE model has been applied to evaluate T cell dysfunction and exclusion signatures across over 33K samples in 188 tumor cohorts from well-curated databases, including TCGA, METABRIC, and PRECOG, as well as our in-house data collections. More information about how TIDE’s measures of immune cell dysfunction and exclusion were derived can be found below and at Peng Jiang, et al.
A command line TIDE is available at https://github.com/liulab-dfci/TIDEpy.
8.2.1 Config.yaml sections relevant to TIDE
For running TIDE within RIMA, the config.yaml file contains a few parameters that affect the results. The top half of a sample config.yaml file is included below for reference. If “cancer_type” is NSCLC or Melanoma, TIDE will use the response prediction parameters that were developed specifically for these cancer types. The parameter “pre_treated” is used to indicate whether samples are from participants who received immunotherapy prior to the current study. For cohort reports from TIDE, the phenotype used for comparison is the one identified in the config.yaml cohort parameter section. This section is described in more detail in Chapter 4.2.1. To exclude samples from the analysis, please see how to set up the Group column of the metasheet.csv file in Chapter 2.
---
metasheet: metasheet.csv
ref: ref.yaml
assembly: hg38
cancer_type: GBM  #TCGA cancer type abbreviations or, for TIDE only, NSCLC or Melanoma if applicable
rseqc_ref: house_keeping  #option: 'house_keeping' or 'false'. By default, a subset of housekeeping genes is used by rseqc to assess alignment quality.  This reduces the amount of time needed to run rseqc.
mate: [1,2]               #paired-end fastq format

#########Parameter used for cohort level analysis################
design: Group #condition on which to do comparsion (as set up in metasheet.csv)
Treatment: R
Control: NR
batch: syb_batch          #option: false or a column name from the metasheet.csv.  If set to a column name in the metasheet.csv, the column name will be used for batch effect analysis (limma).  It will also be used as a covariate for differential analysis (DeSeq2) to account for batch effect.

pre_treated: false          #option: true or false. If set to false, patients are treatment naive.  If set to true, patients have received some form of therapy prior to the current study.
8.2.2 Cold and hot tumors
TIDE estimates the cytotoxic T Lymphocyte (CTL) level in tumors from the average expression of CD8A, CD8B, GZM, GZMB and PRF1 from treatment naïve tumors. ‘Hot tumors’ have above-average CTL values among all samples, while ‘Cold tumors’ have CTL values below average. The TIDE score is a combination of the T cell dysfunction estimated from hot tumors and the T cell exclusion estimated from cold tumors.
8.2.3 T cell dysfunction
TIDE’s T cell dysfunction score was derived by systematically identifying genes that interact with CTL infiltration levels to influence patient survival. The genes utilized for the T-cell dysfunction model were identified in the following manner.
For hot tumors with high CTL values, the T cell dysfunction is modeled from Cox-PH regression:
\[
Hazard = a*CTL+b*P+d*CTL*P
\]
Where the variable CTL represents the CTL level, P represents the expression level of a candidate gene and the coefficient d reflects the effect of the interaction between the CTL and candidate gene P on death hazard.
The T cell dysfunction score of each gene is calculated as: \[ Dysfunction = \frac{d}{StdErr(d)} \] Dysfunction scores of each gene were then compared to identify genes with statistically significant influences on CTL and death hazard.
8.2.4 T cell exclusion
TIDE calculates a T cell exclusion score to estimate immune escape. The T cell exclusion score is derived from the expression profiles of three cell types which have been reported to restrict T cell infiltration in tumors – cancer-associated fibroblasts (CAFs), myeloid-derived suppressor cells (MDSCs) and tumor-associated macrophages (TAMs).
8.2.5 Normalization
The input for TIDE is a normalized TPM matrix, the steps for normalization are:
- Log transform the data – log2(TPM+1).
- For each gene, subtract the average of the log transformed expression levels across all of your samples.
8.2.6 Running TIDE
TIDE supports cancer type specific analysis of melanoma and non-small cell lung cancer (NSCLC). In our example, the data is from glioblastoma multiforme (GBM), so RIMA will set -c as other cancer type and force TIDE to normalize the TPM matrix.
TIDE is run from a command line interface with a command like the following:
tidepy -o TIDE_score.txt -c Other --force_normalization tpm_convertID.txt
Example outputs of TIDE:
##             X No.benefits Responder       TIDE        IFNG    MSI.Score
## 1  SRR8281219       False     False  1.6807050  0.05776435 0.9171423549
## 2  SRR8281236       False     False  1.4737267 -0.44182240 0.0891168795
## 3  SRR8281251       False     False  0.3144625  0.72752075 0.9280729250
## 4  SRR8281233       False      True -0.5123185  0.34811417 0.5993703233
## 5  SRR8281244       False      True -0.9853986  0.21431441 0.9799730558
## 6  SRR8281238       False      True -1.9248032 -0.90589129 0.0009766364
## 7  SRR8281230        True     False  1.1296130 -1.26863334 0.2538437260
## 8  SRR8281245       False     False  0.4289897  3.88767936 0.0017826161
## 9  SRR8281250       False     False  0.3857392 -1.24755461 0.9386137813
## 10 SRR8281226       False     False  0.1014286 -1.21158487 0.9948723196
## 11 SRR8281218       False      True -0.6018754 -1.00643540 0.9824508826
## 12 SRR8281243       False      True -0.6690983  0.84652886 0.0098136280
##           CD274        CD8 CTL.flag Dysfunction  Exclusion        MDSC
## 1   1.614004697  1.0782170    False -0.80734665  1.6807050  0.12475420
## 2  -0.571334617 -1.9530623    False -0.35635988  1.4737267  0.11729077
## 3  -0.000579565 -1.3454258    False -0.37740657  0.3144625  0.10977895
## 4  -0.411058820 -0.6337873    False  0.53196445 -0.5123185 -0.14295622
## 5  -0.606725356  3.4653282    False  0.08913789 -0.9853986 -0.10578784
## 6  -0.024306339 -0.6112697    False  0.92111671 -1.9248032 -0.11623220
## 7   0.770622520 -1.5651339    False -0.37601870  1.1296130  0.09720250
## 8   1.057713700  5.4054676     True  0.42898972 -0.5965523 -0.04806820
## 9  -1.316139124 -1.0777690    False -0.23234131  0.3857392  0.05575237
## 10 -0.867420745 -1.6865379    False -0.80196436  0.1014286 -0.01248780
## 11 -1.080325919 -0.2808955    False  0.39883468 -0.6018754 -0.05455741
## 12  1.435549568 -0.7951312    False  0.70257668 -0.6690983 -0.05677437
##            CAF       TAM.M2
## 1   0.15396889 -0.026495315
## 2   0.07706755  0.026260679
## 3  -0.08909806  0.018044264
## 4   0.05095308  0.014947245
## 5  -0.04049768 -0.009330085
## 6  -0.14906967 -0.015234391
## 7   0.06391605  0.003882855
## 8   0.03353989 -0.073846662
## 9  -0.03536659  0.035777532
## 10  0.02156957  0.002648255
## 11 -0.08670749  0.057716177
## 12 -0.01752071 -0.019989212
8.3 Microsatelite instability (MSI)
Microsatelite instability (MSI) is the condition of genetic hypermutability (predisposition to mutation) that results from impaired DNA mismatch repair (MMR). Previous studies show that the MSI is highly associated with tumor mutation burden and closly related to immunotherapy response. Many tools such as MANTIS, MSIsensor, mSINGS and MSIsensor-pro are available to calculate MSI scores from RNA-seq data. In our RIMA pipeline, we applied MSIsensor2 to estimate MSI scores, which allows for tumor-only BAM input.
#Run MSIsensor2
msisensor2 msi -M models_hg38 -t tumor.bam -o tumor

## Output of MSIsensor2
Total_Number_of_Sites   Number_of_Somatic_Sites %
156                     26                     16.67
Example of combined MSI outputs:
##            V1    V2
## 1  SRR8281218 20.34
## 2  SRR8281219 13.39
## 3  SRR8281226 28.00
## 4  SRR8281238 22.11
## 5  SRR8281236 17.69
## 6  SRR8281230 16.10
## 7  SRR8281233 17.97
## 8  SRR8281244 25.71
## 9  SRR8281245 30.43
## 10 SRR8281243 24.11
## 11 SRR8281251 23.44
## 12 SRR8281250 24.59
8.4 Response comparison analysis of biomarkers
RIMA combines the output from TIDE and MSIsensor2 in a report that compares cohorts. The phenotype used for comparison is the one identified in the config.yaml cohort parameter section. This section is described more in Chapter 4.2.1.
#read the metasheet
metafile <- "metasheet.csv"
tide_res <- "TIDE_score.txt"
msi_res <- "msi_score.txt"
#load ploting function
source("Tideploting.R")

cmpr_biomk(msi_path = msi_res, tide_path = tide_res, meta_path = metafile, phenotype = "Responder")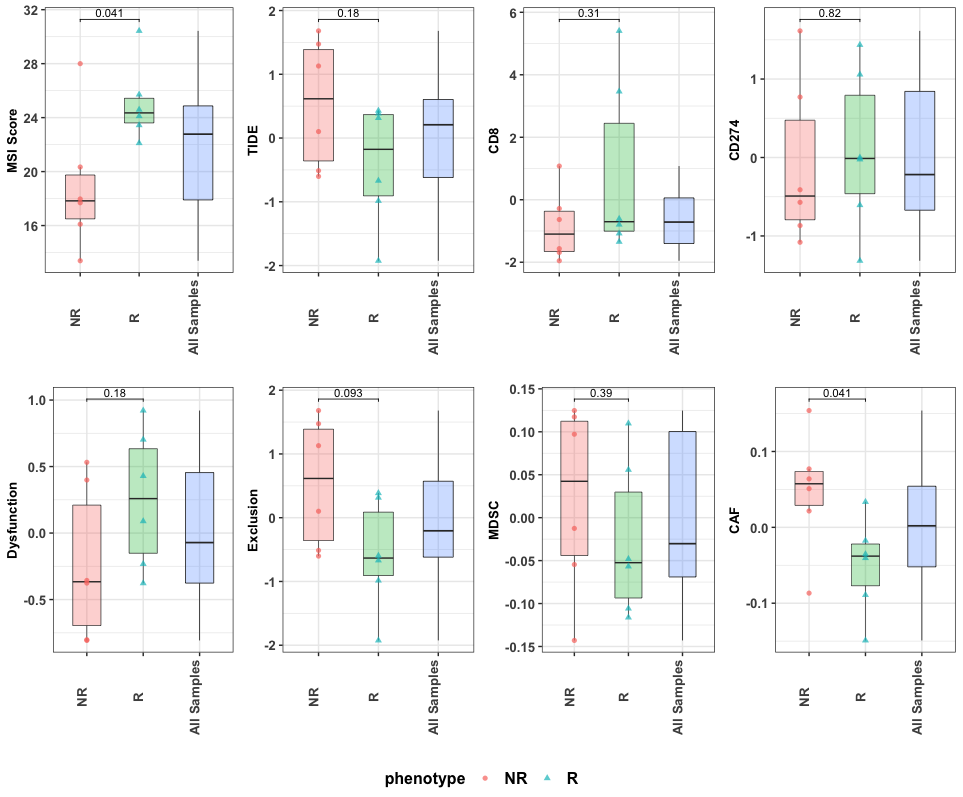
Figure 8.1: Comparision of biomarkers between R and NR